Blog
Insights
Yada Q2 2026 Results: Repeat Guests Are Becoming a Direct Booking Growth Engine
A privacy-safe analysis of 62,982 bookings, 4,496 direct bookings, and 10 anonymized customer benchmarks from Yada’s Q2 2026 results.
Petar Ojdrovic
Yada

Q2 2026 in one sentence
Across active Yada customer workspaces in the reporting period, 62,982 distinct bookings included 4,496 direct bookings. That means 9.9% of bookings with an identifiable direct or OTA source were direct. Repeat guests generated 1,695 of those direct bookings—37.7% of the total—and Yada-attributed engagement was connected to 170 distinct direct bookings and more than $358,000 in recorded value.
The headline is not simply that direct bookings exist. It is that direct demand is already a material revenue channel, repeat guests supply more than one in three direct bookings, and sustained guest engagement can be connected to measurable booking outcomes.
The strongest Q2 signal: the guest database is not a passive archive. It is an operating asset that can create demand, improve direct-channel mix, and compound over time.
How to read this report
This analysis uses two related but different scopes. The first is the aggregate Q2 results published on yada.ai/results: 62,982 distinct bookings, 4,496 direct bookings, 1,695 repeat direct bookings, at least $6.3 million in direct booking value, and 170 Yada-attributed direct bookings worth more than $358,000.
The second is the Customer Results CMS benchmark table. It contains 10 anonymized customer records labeled Customer A through Customer J. Together, those rows report 2,173 direct bookings plus customer-level direct rate, repeat share, Yada touch rate, and Signal Sends. The CMS cohort is useful for understanding dispersion, but it is not the same as the full aggregate and should not be treated as if it reconciles to all 4,496 direct bookings.
All results in this article are privacy-safe. No guest names, contact details, property names, booking identifiers, or other personally identifiable information are included. Customer labels remain anonymized exactly as they appear in the public results table.
Executive summary
1. Direct booking growth is already material
The cohort produced 4,496 direct bookings and at least $6.3 million in direct booking value during Q2 2026. Direct bookings represented 9.9% of bookings with an identifiable direct or OTA source. On the published totals, that is at least roughly $1,400 in direct booking value per direct booking, although the true average may be higher because the value headline is stated as a minimum.
2. Repeat guests are the largest visible growth lever
Repeat guests generated 1,695 direct bookings, equal to 37.7% of the direct total. In practical terms, more than one out of every three direct bookings came from a guest who had already stayed with the same operator. This is the clearest evidence in the Q2 dataset that first-party guest history can translate into future direct demand.
3. Engagement is connected to measurable value
Yada-attributed engagement was linked to 170 distinct direct bookings and more than $358,000 in recorded value. That works out to more than $2,100 in recorded value per attributed booking on the published minimum. Attribution here is an observed connection under the stated methodology—not proof that every booking would have disappeared without the engagement—but it provides a concrete measurement layer beyond opens, clicks, and sends.
4. Customer performance is highly uneven
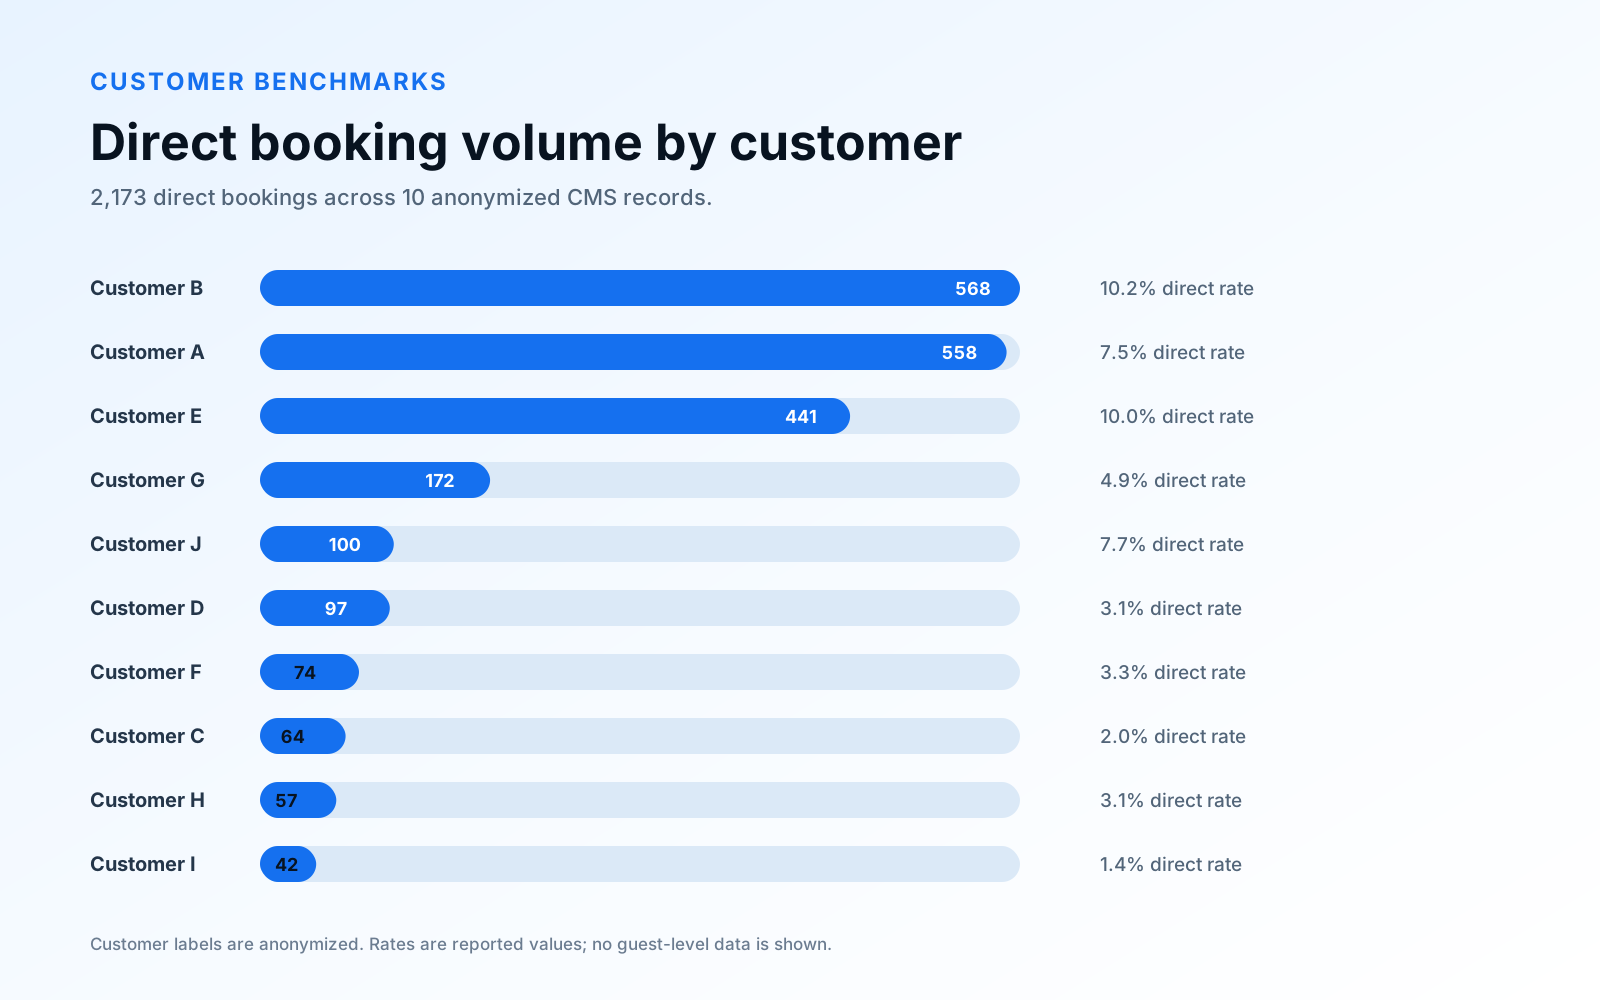
The 10 anonymized CMS records range from 42 to 568 direct bookings, from 1.4% to 10.2% direct rate, from 5.3% to 80.3% repeat share, and from 0% to 21.9% Yada touch rate. This spread matters: a single benchmark is unlikely to describe every operator’s opportunity. Portfolio size, source mix, guest history, seasonality, data coverage, and maturity all shape the result.
What the aggregate results say
Direct is a meaningful channel, not a rounding error
A 9.9% direct share means nearly one in ten identifiable bookings bypassed an OTA source in the reporting period. The significance is strategic as well as financial. Direct bookings can create a durable guest relationship, preserve first-party data, reduce reliance on marketplace discovery, and make future retention efforts easier to measure.
The dataset does not claim that 9.9% is a universal target. It shows that the direct channel is already large enough to manage deliberately. Operators should be able to see direct share by period, understand which guests and campaigns contribute to it, and measure whether the share is improving without sacrificing total booking volume.
Repeat demand is doing substantial work
The repeat guest share of direct bookings is 37.7%, or 1,695 bookings. That concentration is important because repeat demand has different economics and different operating requirements from first-time demand. The guest already knows the brand and product. The operator’s task shifts from generating trust from scratch to remaining memorable, relevant, and easy to book.
This also explains why guest data quality matters. Duplicate profiles, disconnected booking histories, missing contact permissions, and inaccessible PMS data reduce the usable audience. A unified guest record makes it possible to identify prior stays, segment by timing and value, suppress inappropriate messages, and personalize the next offer.
Attribution moves the conversation from activity to outcomes
The Q2 results connect Yada engagement to 170 distinct direct bookings and more than $358,000 in recorded value. The methodology counts a confirmed direct booking once even when several engagement records are connected to it. This prevents one booking from being multiplied by multiple touches and keeps the headline focused on booking outcomes rather than message activity.
The appropriate interpretation is conservative: engagement and bookings are connected in the data. The result supports investment in measurement, segmentation, and consistent follow-up. It does not by itself isolate the incremental causal lift of a particular message, channel, or workflow.
Inside the 10-customer benchmark cohort
The Customer Results CMS contains 10 Q2 2026 rows and 2,173 direct bookings in total. The mean is 217.3 direct bookings per customer, but the median is only 98.5. That gap shows that the distribution is top-heavy: a few large results pull the average upward.
Customer B leads with 568 direct bookings and the highest reported direct rate at 10.2%. Customer A follows with 558 direct bookings at a 7.5% direct rate. Customer E adds 441 direct bookings at a 10.0% direct rate. Together, these three customers account for 1,567 direct bookings, or 72.1% of the CMS cohort total.
Volume leaders are not identical
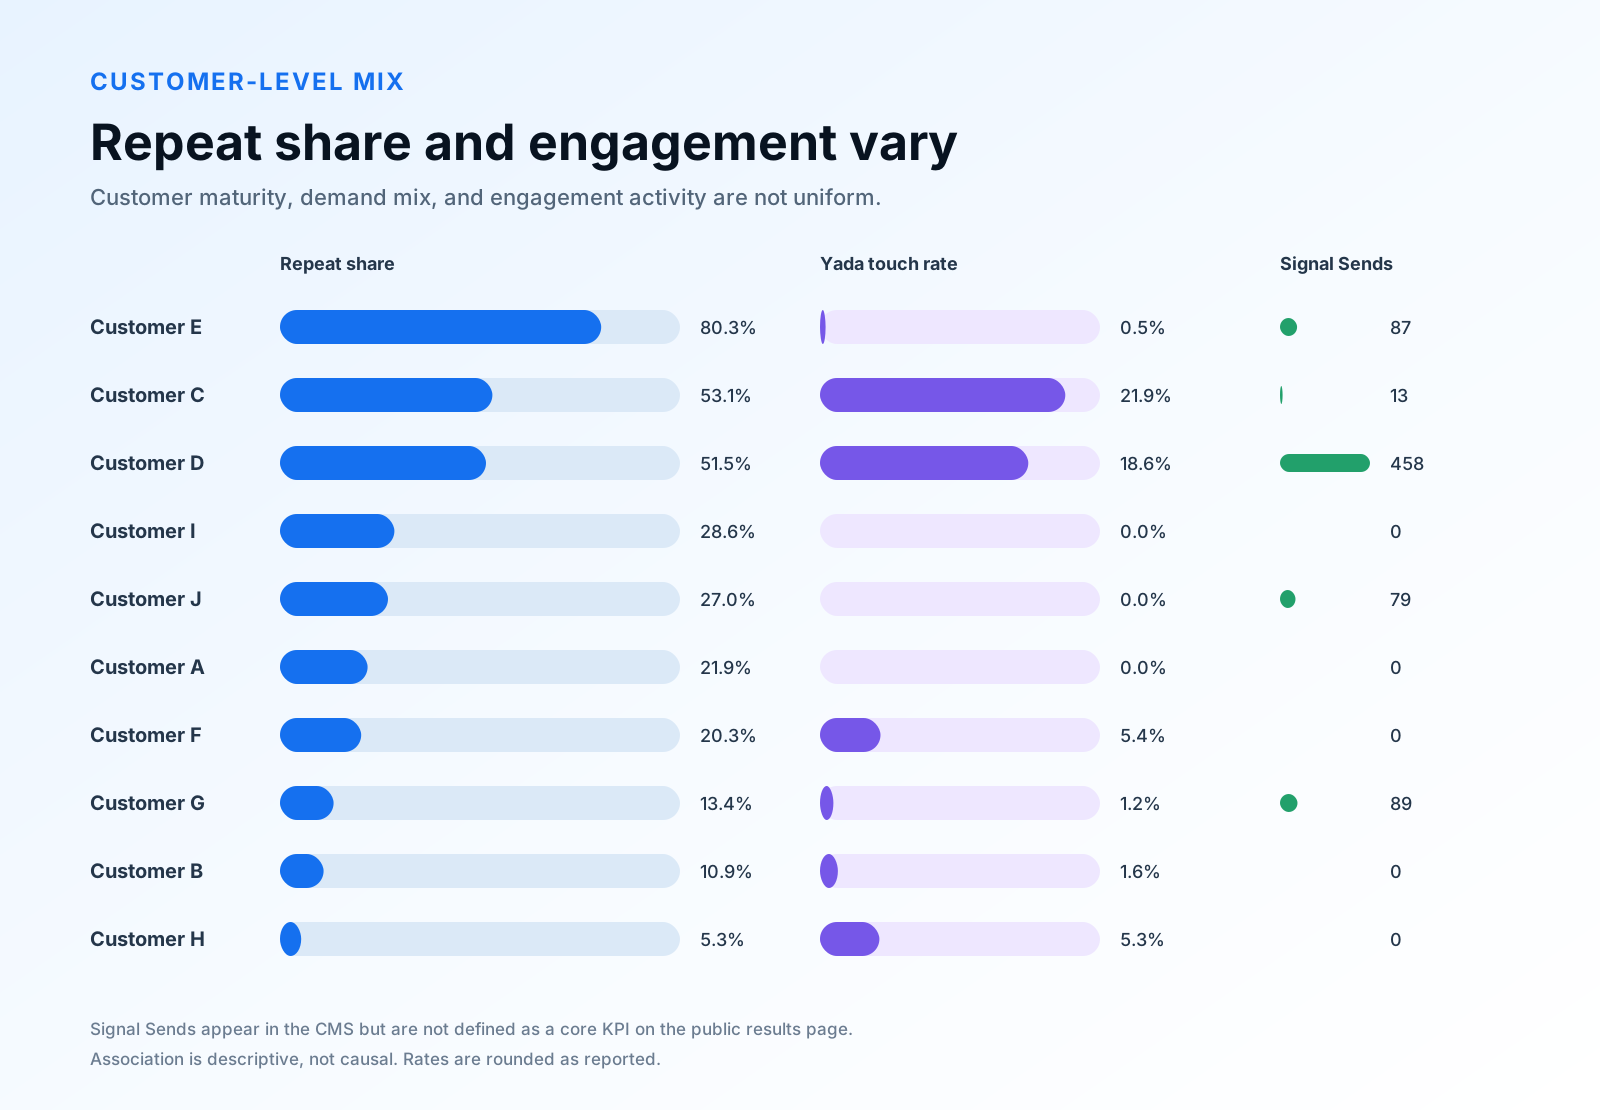
Customer B combines the highest direct-booking count with the highest direct rate, but only 10.9% of its direct bookings are repeat. Customer A has nearly the same volume, a lower 7.5% direct rate, and a 21.9% repeat share. Customer E has slightly lower volume, a 10.0% direct rate, and an unusually high 80.3% repeat share. Similar direct volume can therefore come from very different guest mixes.
Repeat share varies more than the headline average suggests
Across the CMS rows, repeat share runs from 5.3% for Customer H to 80.3% for Customer E. Customer C and Customer D are also repeat-heavy at 53.1% and 51.5%. Weighting each customer’s repeat share by its direct-booking count produces an approximate cohort repeat share of 32.3%. This is directionally consistent with the aggregate story, but it is lower than the 37.7% page-wide result and should remain labeled as an approximation because the percentages are rounded and the scopes differ.
Engagement coverage is uneven
Yada touch rate ranges from 0% to 21.9%. Customer C is highest at 21.9%, followed by Customer D at 18.6%. Seven of the 10 rows have a non-zero touch rate, while three report 0%. Weighted by direct bookings, the CMS cohort’s approximate touch rate is 2.4%. Again, this is a derived benchmark for the 10 records, not a replacement for the published aggregate attribution result.
Signal Sends require cautious interpretation
The CMS includes a Signal Sends field totaling 726 across the 10 rows. Customer D contributes 458, or about 63% of the total, while Customers C, E, G, and J report 13, 87, 89, and 79 respectively. Five customers report zero. Because the public results page does not define Signal Sends as a headline KPI or explain its denominator, this report includes the field for completeness but does not use it to calculate conversion or causal impact.
Customer-by-customer snapshot
Customer A: 558 direct bookings; 7.5% direct rate; 21.9% repeat share; 0% Yada touch rate; 0 Signal Sends. Customer B: 568 direct bookings; 10.2% direct rate; 10.9% repeat share; 1.6% Yada touch rate; 0 Signal Sends.
Customer C: 64 direct bookings; 2.0% direct rate; 53.1% repeat share; 21.9% Yada touch rate; 13 Signal Sends. Customer D: 97 direct bookings; 3.1% direct rate; 51.5% repeat share; 18.6% Yada touch rate; 458 Signal Sends.
Customer E: 441 direct bookings; 10.0% direct rate; 80.3% repeat share; 0.5% Yada touch rate; 87 Signal Sends. Customer F: 74 direct bookings; 3.3% direct rate; 20.3% repeat share; 5.4% Yada touch rate; 0 Signal Sends.
Customer G: 172 direct bookings; 4.9% direct rate; 13.4% repeat share; 1.2% Yada touch rate; 89 Signal Sends. Customer H: 57 direct bookings; 3.1% direct rate; 5.3% repeat share; 5.3% Yada touch rate; 0 Signal Sends.
Customer I: 42 direct bookings; 1.4% direct rate; 28.6% repeat share; 0% Yada touch rate; 0 Signal Sends. Customer J: 100 direct bookings; 7.7% direct rate; 27.0% repeat share; 0% Yada touch rate; 79 Signal Sends.
What operators can do with these results
1. Manage direct share as a core business metric
Track direct bookings, direct booking value, and direct rate by reporting period. Separate channel mix from total demand so the team can see whether direct growth is additive, substitutive, or seasonal. Use unique booking IDs to prevent duplicates and keep every metric tied to confirmed outcomes.
2. Treat guest history as a reusable demand asset
A repeat share of 37.7% at the aggregate level means the past-guest database is already producing meaningful volume. Operators should unify stay history, resolve duplicate guests, preserve consent and contact preferences, and create segments based on recency, frequency, value, destination, season, and prior behavior.
3. Build continuous, relevant engagement
The goal is not to send more messages indiscriminately. It is to maintain useful contact between stays: relevant availability, return timing, loyalty value, destination content, gap-night opportunities, and responses to observed intent. Cadence, eligibility, quiet hours, opt-out handling, and suppression rules should be part of the operating system, not an afterthought.
4. Benchmark by maturity, not only by average
The CMS distribution shows why one-size-fits-all targets are weak. A customer with 80.3% repeat share has a different growth question from one at 5.3%. A customer with a 10.2% direct rate should investigate how to preserve and scale that mix; a customer at 1.4% should first validate source classification, booking-path friction, audience coverage, and the fundamentals of direct demand generation.
5. Measure outcomes and coverage together
Booking attribution shows outcomes, but coverage metrics explain the opportunity set. Track how many eligible guests can be reached, how much of the database has usable contact permission, how many bookings have identifiable source data, and how many direct bookings are connected to a measurable engagement history. Improving coverage can be as important as improving campaign performance.
Methodology
The published results cover active Yada customer workspaces with both confirmed booking activity and successful Yada engagement during the reporting period. Every confirmed booking is counted once using its unique booking ID.
Direct booking rate uses bookings with an identifiable direct or OTA source. Repeat bookings come from guests with an earlier confirmed or reserved stay at the same operator. Recorded value uses booking data available in the connected property management system. Yada-attributed results count each confirmed direct booking once, even when several engagement records are connected to it.
The customer-level CMS figures are reported values for Q2 2026. Any weighted cohort figures in this article are calculated from those displayed values and are approximate because the underlying percentages are rounded. No guest-level data was accessed or reproduced for this report.
Limitations and responsible interpretation
This is a quarterly snapshot, not a trend line
The available records are all labeled Q2 2026. Without comparable prior-period rows, the report cannot claim quarter-over-quarter growth, acceleration, or seasonally adjusted improvement. Future reporting periods should preserve the same definitions so genuine trends can be measured.
The aggregate and CMS cohorts do not fully reconcile
The public aggregate reports 4,496 direct bookings. The 10 customer CMS rows sum to 2,173. The most responsible conclusion is that the CMS table is a subset or differently scoped customer benchmark. This article never extrapolates the 10-row distribution to the full aggregate without labeling the distinction.
Attribution is not the same as incremental causality
A booking connected to engagement is a useful measurement signal, but it does not by itself prove that the engagement caused the booking or quantify what would have happened in its absence. Incrementality requires additional experimental or quasi-experimental design, such as holdouts, matched comparisons, or carefully constructed before-and-after analysis.
Data coverage shapes every result
Source classification, historical stay coverage, identity resolution, PMS value completeness, and engagement records all affect the reported metrics. A lower rate may reflect a weaker business outcome, incomplete data, or both. Operators should audit coverage alongside performance before making major decisions.
The bottom line
Q2 2026 shows a direct booking channel with real scale: 4,496 bookings, at least $6.3 million in direct value, and nearly one in ten identifiable bookings coming direct. The most important contributor is the existing guest relationship. Repeat guests generated 37.7% of direct bookings, while measured Yada engagement was connected to 170 direct bookings and more than $358,000 in recorded value.
The customer-level detail adds the strategic nuance. Results are uneven, maturity differs, and there is no universal benchmark. The operators best positioned to compound these gains will be the ones that make guest data usable, keep engagement relevant and permission-aware, and measure confirmed bookings rather than message activity alone.
Explore the live Q2 results and customer benchmark table at yada.ai/results.
Petar Ojdrovic
Yada
Share

